Basic Bioconductor infrastructure
IRanges
library(IRanges)
## Loading required package: methods
## Loading required package: BiocGenerics
## Loading required package: parallel
##
## Attaching package: 'BiocGenerics'
##
## The following objects are masked from 'package:parallel':
##
##     clusterApply, clusterApplyLB, clusterCall, clusterEvalQ,
##     clusterExport, clusterMap, parApply, parCapply, parLapply,
##     parLapplyLB, parRapply, parSapply, parSapplyLB
##
## The following object is masked from 'package:stats':
##
##     xtabs
##
## The following objects are masked from 'package:base':
##
##     anyDuplicated, append, as.data.frame, as.vector, cbind,
##     colnames, do.call, duplicated, eval, evalq, Filter, Find, get,
##     intersect, is.unsorted, lapply, Map, mapply, match, mget,
##     order, paste, pmax, pmax.int, pmin, pmin.int, Position, rank,
##     rbind, Reduce, rep.int, rownames, sapply, setdiff, sort,
##     table, tapply, union, unique, unlist, unsplit
##
## Loading required package: S4Vectors
## Loading required package: stats4
ir <- IRanges(5,10)
ir
## IRanges of length 1
##     start end width
## [1]     5  10     6
start(ir)
## [1] 5
end(ir)
## [1] 10
width(ir)
## [1] 6
# ?IRanges
ir <- IRanges(start=c(3,5,17), end=c(10,8,20))
ir
## IRanges of length 3
##     start end width
## [1]     3  10     8
## [2]     5   8     4
## [3]    17  20     4
ir <- IRanges(5,10)
# ?"intra-range-methods"
shift(ir, -2)
## IRanges of length 1
##     start end width
## [1]     3   8     6
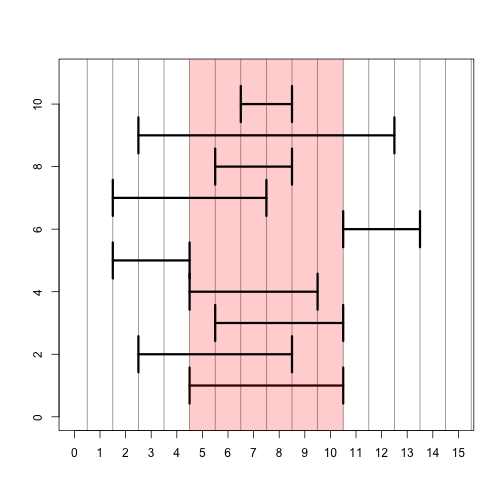
Remeber, all of these commands can work on more than one range at once. Here we show the effects of the different methods using a single range:
shift(ir,-2)
## IRanges of length 1
##     start end width
## [1]     3   8     6
narrow(ir, start=2)
## IRanges of length 1
##     start end width
## [1]     6  10     5
narrow(ir, end=5)
## IRanges of length 1
##     start end width
## [1]     5   9     5
flank(ir, width=3, start=TRUE, both=FALSE)
## IRanges of length 1
##     start end width
## [1]     2   4     3
flank(ir, width=3, start=FALSE, both=FALSE)
## IRanges of length 1
##     start end width
## [1]    11  13     3
flank(ir, width=3, start=TRUE, both=TRUE)
## IRanges of length 1
##     start end width
## [1]     2   7     6
ir * 2
## IRanges of length 1
##     start end width
## [1]     6   8     3
ir + 2
## IRanges of length 1
##     start end width
## [1]     3  12    10
ir - 2
## IRanges of length 1
##     start end width
## [1]     7   8     2
# set up a plotting window so we can look at range operations
plotir <- function(ir,i) { arrows(start(ir)-.5,i,end(ir)+.5,i,code=3,angle=90,lwd=3) }
plot(0,0,xlim=c(0,15),ylim=c(0,11),type="n",xlab="",ylab="",xaxt="n")
axis(1,0:15)
abline(v=0:30 + .5,col=rgb(0,0,0,.5))

# plot the original IRange
plotir(ir,1)

# draw a red shadow for the original IRange
polygon(c(start(ir)-.5,start(ir)-.5,end(ir)+.5,end(ir)+.5),c(-1,12,12,-1),col=rgb(1,0,0,.2),border=NA)
plotir(shift(ir,-2), 2)
plotir(narrow(ir, start=2), 3)
plotir(narrow(ir, end=5), 4)
plotir(flank(ir, width=3, start=TRUE, both=FALSE), 5)
plotir(flank(ir, width=3, start=FALSE, both=FALSE), 6)
plotir(flank(ir, width=3, start=TRUE, both=TRUE), 7)
plotir(ir * 2, 8)
plotir(ir + 2, 9)
plotir(ir - 2, 10)
# ?"inter-range-methods"
ir <- IRanges(start=c(3,5,17), end=c(10,8,20))
range(ir)
## IRanges of length 1
##     start end width
## [1]     3  20    18
reduce(ir)
## IRanges of length 2
##     start end width
## [1]     3  10     8
## [2]    17  20     4
gaps(ir)
## IRanges of length 1
##     start end width
## [1]    11  16     6
disjoin(ir)
## IRanges of length 4
##     start end width
## [1]     3   4     2
## [2]     5   8     4
## [3]     9  10     2
## [4]    17  20     4
GRanges and GRangesList
GRanges
library(GenomicRanges)
## Loading required package: GenomeInfoDb
gr <- GRanges("chrZ", IRanges(start=c(5,10),end=c(35,45)),
              strand="+", seqlengths=c(chrZ=100L))
gr
## GRanges object with 2 ranges and 0 metadata columns:
##       seqnames    ranges strand
##          <Rle> <IRanges>  <Rle>
##   [1]     chrZ  [ 5, 35]      +
##   [2]     chrZ  [10, 45]      +
##   -------
##   seqinfo: 1 sequence from an unspecified genome
shift(gr, 10)
## GRanges object with 2 ranges and 0 metadata columns:
##       seqnames    ranges strand
##          <Rle> <IRanges>  <Rle>
##   [1]     chrZ  [15, 45]      +
##   [2]     chrZ  [20, 55]      +
##   -------
##   seqinfo: 1 sequence from an unspecified genome
shift(gr, 80)
## Warning in valid.GenomicRanges.seqinfo(x, suggest.trim = TRUE): GRanges object contains 2 out-of-bound ranges located on sequence
##   chrZ. Note that only ranges located on a non-circular sequence
##   whose length is not NA can be considered out-of-bound (use
##   seqlengths() and isCircular() to get the lengths and circularity
##   flags of the underlying sequences). You can use trim() to trim
##   these ranges. See ?`trim,GenomicRanges-method` for more
##   information.
## GRanges object with 2 ranges and 0 metadata columns:
##       seqnames    ranges strand
##          <Rle> <IRanges>  <Rle>
##   [1]     chrZ [85, 115]      +
##   [2]     chrZ [90, 125]      +
##   -------
##   seqinfo: 1 sequence from an unspecified genome
trim(shift(gr, 80))
## GRanges object with 2 ranges and 0 metadata columns:
##       seqnames    ranges strand
##          <Rle> <IRanges>  <Rle>
##   [1]     chrZ [85, 100]      +
##   [2]     chrZ [90, 100]      +
##   -------
##   seqinfo: 1 sequence from an unspecified genome
mcols(gr)
## DataFrame with 2 rows and 0 columns
mcols(gr)$value <- c(-1,4)
gr
## GRanges object with 2 ranges and 1 metadata column:
##       seqnames    ranges strand |     value
##          <Rle> <IRanges>  <Rle> | <numeric>
##   [1]     chrZ  [ 5, 35]      + |        -1
##   [2]     chrZ  [10, 45]      + |         4
##   -------
##   seqinfo: 1 sequence from an unspecified genome
GRangesList
gr2 <- GRanges("chrZ",IRanges(11:13,51:53))
mcols(gr)$value <- NULL
grl <- GRangesList(gr,gr2)
grl
## GRangesList object of length 2:
## [[1]]
## GRanges object with 2 ranges and 0 metadata columns:
##       seqnames    ranges strand
##          <Rle> <IRanges>  <Rle>
##   [1]     chrZ  [ 5, 35]      +
##   [2]     chrZ  [10, 45]      +
##
## [[2]]
## GRanges object with 3 ranges and 0 metadata columns:
##       seqnames   ranges strand
##   [1]     chrZ [11, 51]      *
##   [2]     chrZ [12, 52]      *
##   [3]     chrZ [13, 53]      *
##
## -------
## seqinfo: 1 sequence from an unspecified genome
length(grl)
## [1] 2
grl[[1]]
## GRanges object with 2 ranges and 0 metadata columns:
##       seqnames    ranges strand
##          <Rle> <IRanges>  <Rle>
##   [1]     chrZ  [ 5, 35]      +
##   [2]     chrZ  [10, 45]      +
##   -------
##   seqinfo: 1 sequence from an unspecified genome
mcols(grl)$value <- c(5,7)
grl
## GRangesList object of length 2:
## [[1]]
## GRanges object with 2 ranges and 0 metadata columns:
##       seqnames    ranges strand
##          <Rle> <IRanges>  <Rle>
##   [1]     chrZ  [ 5, 35]      +
##   [2]     chrZ  [10, 45]      +
##
## [[2]]
## GRanges object with 3 ranges and 0 metadata columns:
##       seqnames   ranges strand
##   [1]     chrZ [11, 51]      *
##   [2]     chrZ [12, 52]      *
##   [3]     chrZ [13, 53]      *
##
## -------
## seqinfo: 1 sequence from an unspecified genome
mcols(grl)
## DataFrame with 2 rows and 1 column
##       value
##   <numeric>
## 1         5
## 2         7
findOverlaps and %over%
gr1 <- GRanges("chrZ",IRanges(c(1,11,21,31,41),width=5))
gr2 <- GRanges("chrZ",IRanges(c(19,33),c(38,35)))
gr1
## GRanges object with 5 ranges and 0 metadata columns:
##       seqnames    ranges strand
##          <Rle> <IRanges>  <Rle>
##   [1]     chrZ  [ 1,  5]      *
##   [2]     chrZ  [11, 15]      *
##   [3]     chrZ  [21, 25]      *
##   [4]     chrZ  [31, 35]      *
##   [5]     chrZ  [41, 45]      *
##   -------
##   seqinfo: 1 sequence from an unspecified genome; no seqlengths
gr2
## GRanges object with 2 ranges and 0 metadata columns:
##       seqnames    ranges strand
##          <Rle> <IRanges>  <Rle>
##   [1]     chrZ  [19, 38]      *
##   [2]     chrZ  [33, 35]      *
##   -------
##   seqinfo: 1 sequence from an unspecified genome; no seqlengths
fo <- findOverlaps(gr1, gr2)
fo
## Hits of length 3
## queryLength: 5
## subjectLength: 2
##   queryHits subjectHits
##    <integer>   <integer>
##  1         3           1
##  2         4           1
##  3         4           2
queryHits(fo)
## [1] 3 4 4
subjectHits(fo)
## [1] 1 1 2
gr1 %over% gr2
## [1] FALSE FALSE TRUE TRUE FALSE
gr1[gr1 %over% gr2]
## GRanges object with 2 ranges and 0 metadata columns:
##       seqnames    ranges strand
##          <Rle> <IRanges>  <Rle>
##   [1]     chrZ  [21, 25]      *
##   [2]     chrZ  [31, 35]      *
##   -------
##   seqinfo: 1 sequence from an unspecified genome; no seqlengths
Rle and Views
r <- Rle(c(1,1,1,0,0,-2,-2,-2,rep(-1,20)))
r
## numeric-Rle of length 28 with 4 runs
##   Lengths:  3  2  3 20
##   Values :  1  0 -2 -1
str(r)
## Formal class 'Rle' [package "S4Vectors"] with 4 slots
##   ..@ values         : num [1:4] 1 0 -2 -1
##   ..@ lengths        : int [1:4] 3 2 3 20
##   ..@ elementMetadata: NULL
##   ..@ metadata       : list()
as.numeric(r)
##  [1]  1  1  1  0  0 -2 -2 -2 -1 -1 -1 -1 -1 -1 -1 -1 -1 -1 -1 -1 -1 -1 -1
## [24] -1 -1 -1 -1 -1
Views(r, start=c(4,2), end=c(7,6))
## Views on a 28-length Rle subject
##
## views:
##     start end width
## [1]     4   7     4 [ 0  0 -2 -2]
## [2]     2   6     5 [ 1  1  0  0 -2]
ExpressionSet and SummarizedExperiment
library(Biobase)
## Welcome to Bioconductor
##
##     Vignettes contain introductory material; view with
##     'browseVignettes()'. To cite Bioconductor, see
##     'citation("Biobase")', and for packages 'citation("pkgname")'.
library(GEOquery)
## Error in library(GEOquery): there is no package called 'GEOquery'
geoq <- getGEO("GSE9514")
## Error in eval(expr, envir, enclos): could not find function "getGEO"
names(geoq)
## Error in eval(expr, envir, enclos): object 'geoq' not found
e <- geoq[[1]]
## Error in eval(expr, envir, enclos): object 'geoq' not found
ExpressionSet
dim(e)
## Error in eval(expr, envir, enclos): object 'e' not found
exprs(e)[1:3,1:3]
## Error in exprs(e): error in evaluating the argument 'object' in selecting a method for function 'exprs': Error: object 'e' not found
dim(exprs(e))
## Error in exprs(e): error in evaluating the argument 'object' in selecting a method for function 'exprs': Error: object 'e' not found
pData(e)[1:3,1:6]
## Error in pData(e): error in evaluating the argument 'object' in selecting a method for function 'pData': Error: object 'e' not found
dim(pData(e))
## Error in pData(e): error in evaluating the argument 'object' in selecting a method for function 'pData': Error: object 'e' not found
names(pData(e))
## Error in pData(e): error in evaluating the argument 'object' in selecting a method for function 'pData': Error: object 'e' not found
pData(e)$characteristics_ch1
## Error in pData(e): error in evaluating the argument 'object' in selecting a method for function 'pData': Error: object 'e' not found
fData(e)[1:3,1:3]
## Error in fData(e): error in evaluating the argument 'object' in selecting a method for function 'fData': Error: object 'e' not found
dim(fData(e))
## Error in fData(e): error in evaluating the argument 'object' in selecting a method for function 'fData': Error: object 'e' not found
names(fData(e))
## Error in fData(e): error in evaluating the argument 'object' in selecting a method for function 'fData': Error: object 'e' not found
head(fData(e)$"Gene Symbol")
## Error in head(fData(e)$"Gene Symbol"): error in evaluating the argument 'x' in selecting a method for function 'head': Error in fData(e) :
##   error in evaluating the argument 'object' in selecting a method for function 'fData': Error: object 'e' not found
head(rownames(e))
## Error in head(rownames(e)): error in evaluating the argument 'x' in selecting a method for function 'head': Error in rownames(e) :
##   error in evaluating the argument 'x' in selecting a method for function 'rownames': Error: object 'e' not found
experimentData(e)
## Error in experimentData(e): error in evaluating the argument 'object' in selecting a method for function 'experimentData': Error: object 'e' not found
annotation(e)
## Error in annotation(e): error in evaluating the argument 'object' in selecting a method for function 'annotation': Error: object 'e' not found
Summarized Experiment
library(parathyroidSE)
## Error in library(parathyroidSE): there is no package called 'parathyroidSE'
data(parathyroidGenesSE)
## Warning in data(parathyroidGenesSE): data set 'parathyroidGenesSE' not
## found
se <- parathyroidGenesSE
## Error in eval(expr, envir, enclos): object 'parathyroidGenesSE' not found
se
## Error in eval(expr, envir, enclos): object 'se' not found
dim(se)
## Error in eval(expr, envir, enclos): object 'se' not found
assay(se)[1:3,1:3]
## Error in assay(se): error in evaluating the argument 'x' in selecting a method for function 'assay': Error: object 'se' not found
dim(assay(se))
## Error in assay(se): error in evaluating the argument 'x' in selecting a method for function 'assay': Error: object 'se' not found
colData(se)[1:3,1:6]
## Error in colData(se): error in evaluating the argument 'x' in selecting a method for function 'colData': Error: object 'se' not found
dim(colData(se))
## Error in colData(se): error in evaluating the argument 'x' in selecting a method for function 'colData': Error: object 'se' not found
names(colData(se))
## Error in colData(se): error in evaluating the argument 'x' in selecting a method for function 'colData': Error: object 'se' not found
colData(se)$treatment
## Error in colData(se): error in evaluating the argument 'x' in selecting a method for function 'colData': Error: object 'se' not found
rowData(se)[1]
## Error in rowData(se): error in evaluating the argument 'x' in selecting a method for function 'rowData': Error: object 'se' not found
class(rowData(se))
## Error in rowData(se): error in evaluating the argument 'x' in selecting a method for function 'rowData': Error: object 'se' not found
length(rowData(se))
## Error in rowData(se): error in evaluating the argument 'x' in selecting a method for function 'rowData': Error: object 'se' not found
head(rownames(se))
## Error in head(rownames(se)): error in evaluating the argument 'x' in selecting a method for function 'head': Error in rownames(se) :
##   error in evaluating the argument 'x' in selecting a method for function 'rownames': Error: object 'se' not found
metadata(rowData(se))
## Error in metadata(rowData(se)): error in evaluating the argument 'x' in selecting a method for function 'metadata': Error in rowData(se) :
##   error in evaluating the argument 'x' in selecting a method for function 'rowData': Error: object 'se' not found
exptData(se)$MIAME
## Error in exptData(se): error in evaluating the argument 'x' in selecting a method for function 'exptData': Error: object 'se' not found
abstract(exptData(se)$MIAME)
## Error in abstract(exptData(se)$MIAME): error in evaluating the argument 'object' in selecting a method for function 'abstract': Error in exptData(se) :
##   error in evaluating the argument 'x' in selecting a method for function 'exptData': Error: object 'se' not found
Footnotes
For more information about the GenomicRanges package, check out the PLOS Comp Bio paper, which the authors of GenomicRanges published:
http://www.ploscompbiol.org/article/info%3Adoi%2F10.1371%2Fjournal.pcbi.1003118
Also the software vignettes have a lot of details about the functionality. Check out “An Introduction to Genomic Ranges Classes”:
All of the vignette PDFs are available here:
http://www.bioconductor.org/packages/release/bioc/html/GenomicRanges.html