Sketching the binding landscape over chromosomes with ggbio's karyogram layout
There are many interesting approaches to visualizing genome-scale data. Two major packages in Bioconductor are Gviz and ggbio. Both represent significant efforts at bridging the gap between graphics facilities and various genomic data structures.
ggbio’s autoplot method can be very useful for broad overviews.
For a GRanges instance, each range for which data exists can be
depicted as a band on the chromosome. The karyogram layout
gives a genome-wide view, but it can be important to control
the handling of extra-chromosomal sequence levels.
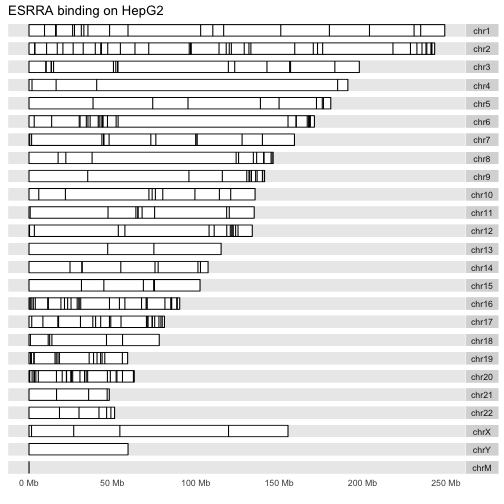
Here is the layout for the liver cell line:
library(ERBS)
data(HepG2)
library(GenomeInfoDb)  # trim all but autosomal chroms
HepG2 = keepStandardChromosomes(HepG2)
data(GM12878)
GM12878 = keepStandardChromosomes(GM12878)
library(ggbio)
autoplot(HepG2, layout="karyogram", main="ESRRA binding on HepG2")
## Scale for 'x' is already present. Adding another scale for 'x', which
## will replace the existing scale.
## Scale for 'x' is already present. Adding another scale for 'x', which
## will replace the existing scale.
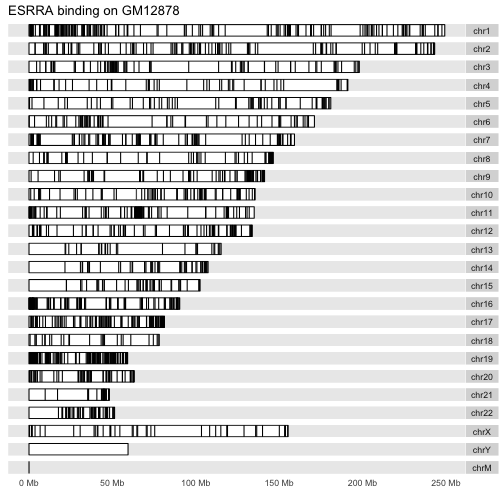
And for the B-cell line:
autoplot(GM12878, layout="karyogram", main="ESRRA binding on GM12878")
## Scale for 'x' is already present. Adding another scale for 'x', which
## will replace the existing scale.
## Scale for 'x' is already present. Adding another scale for 'x', which
## will replace the existing scale.