Exploring Cufflinks output with cummeRbund
Here we show the exploratory plots offered by the cummeRbund package. These plots require loading in a directory in which results from a Cufflinks analysis has been run. Follow the vignette in the above link in order in order to perform a Cufflinks gene- and isoform-level analysis. From the vignette:
CummeRbund begins by re-organizing output files of a cuffdiff analysis, and storing these data in a local SQLite database. CummeRbund indexes the data to speed up access to specific feature data (genes, isoforms, TSS, CDS, etc.), and preserves the various relationships between these features.
library(cummeRbund)
myDir <- system.file("extdata", package="cummeRbund")
gtfFile <- system.file("extdata/chr1_snippet.gtf",package="cummeRbund")
Read in the prepared Cufflinks files from the directory:
cuff <- readCufflinks(dir=myDir,gtfFile=gtfFile,genome="hg19",rebuild=TRUE)
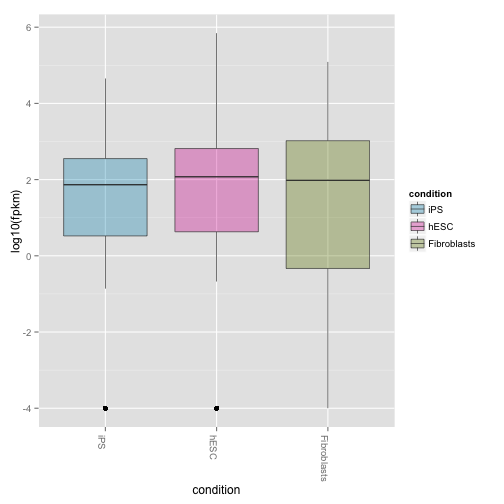
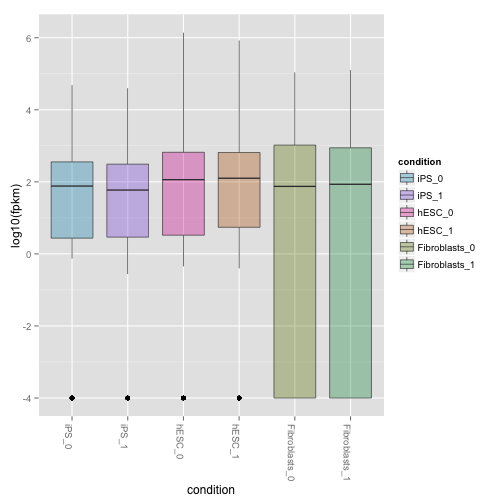
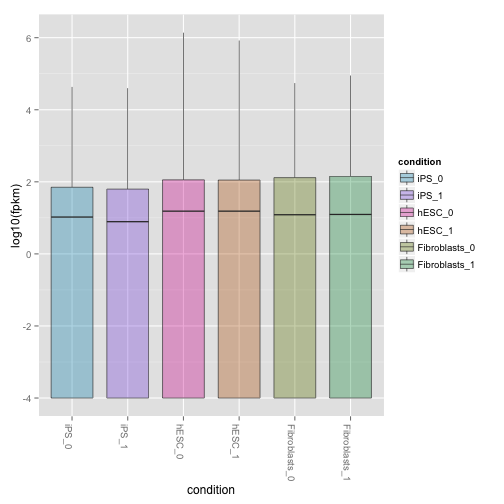
Boxplots of expression (FPKM) at the gene and isoform level:
csBoxplot(genes(cuff))
csBoxplot(genes(cuff),replicates=TRUE)
csBoxplot(isoforms(cuff),replicates=TRUE)
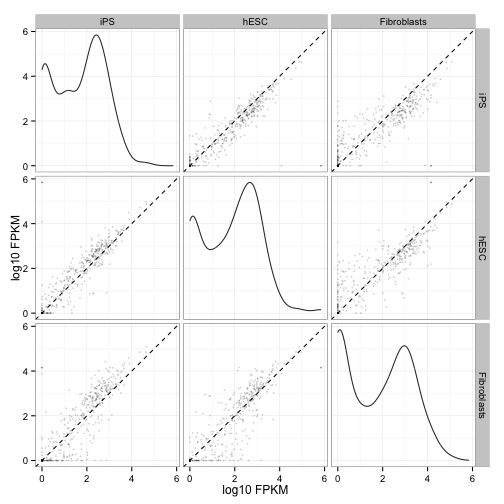
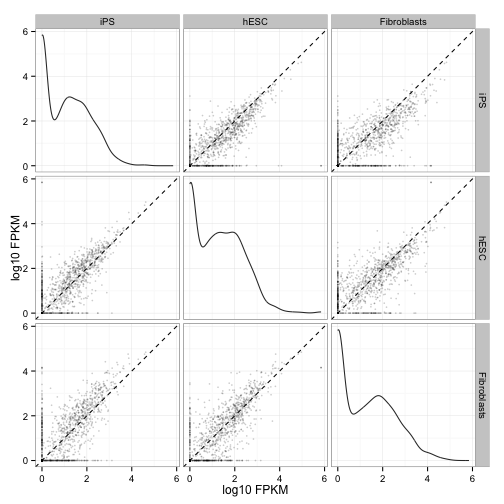
Scatterplot matrix of gene and isoform level expression:
csScatterMatrix(genes(cuff))
csScatterMatrix(isoforms(cuff))
Sample dendrograms using Jensen-Shannon distances:
csDendro(genes(cuff),replicates=TRUE)
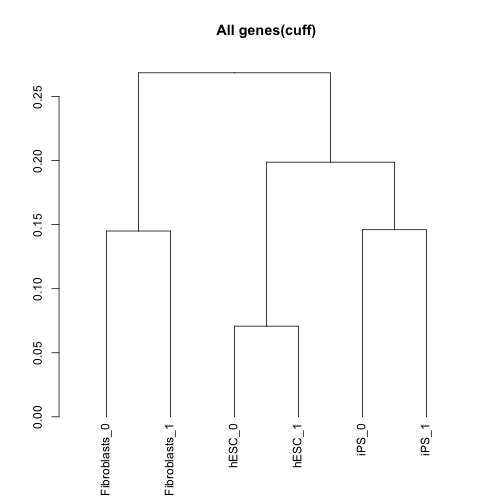
## 'dendrogram' with 2 branches and 6 members total, at height 0.2685017
csDendro(isoforms(cuff),replicates=TRUE)
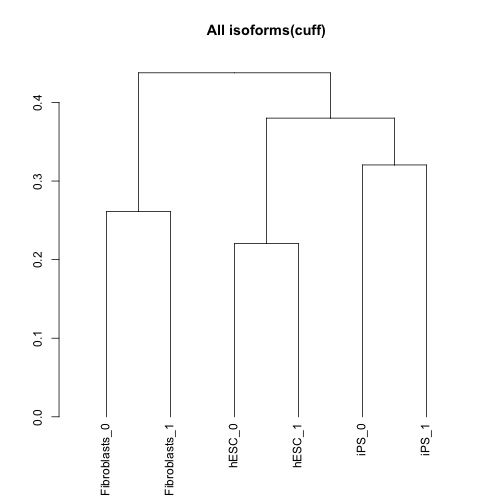
## 'dendrogram' with 2 branches and 6 members total, at height 0.4377249
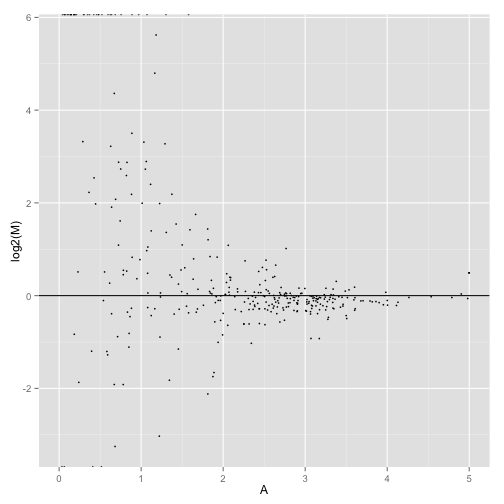
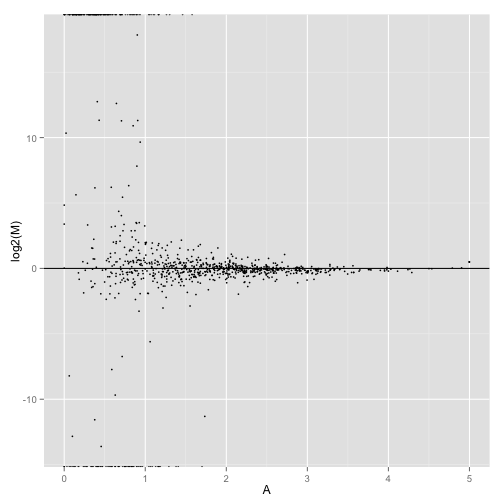
MA-plot comparing two conditions:
MAplot(genes(cuff),"hESC","Fibroblasts")
## Warning in loop_apply(n, do.ply): Removed 54 rows containing missing
## values (geom_point).
MAplot(isoforms(cuff),"hESC","Fibroblasts")
## Warning in loop_apply(n, do.ply): Removed 187 rows containing missing
## values (geom_point).
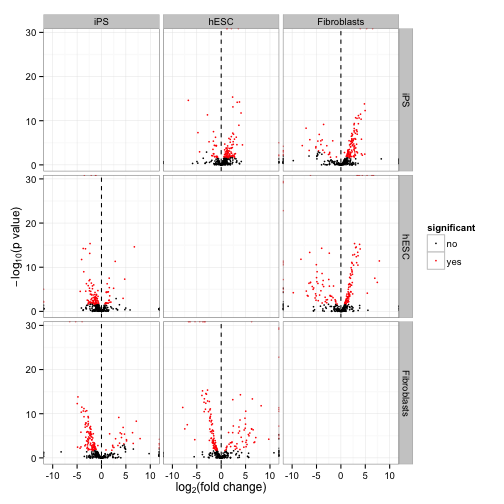
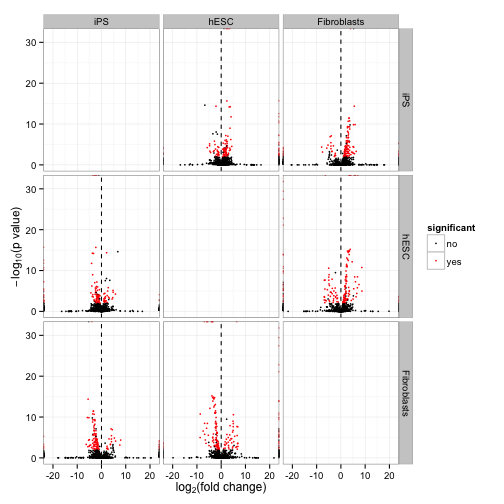
A “volcano plot” matrix. Each volcano plot is the -log10(p-value) over the log fold change.
csVolcanoMatrix(genes(cuff))
csVolcanoMatrix(isoforms(cuff))
For all of these functions, see the help pages in the cummeRbund package for more details, and check the vignette for a sample workflow. The Cufflinks homepage has details about running the pipeline upstream of producing these figures.
browseVignettes("cummeRbund")