Rotations
Rotations
One of the most useful applications of projections relates to coordinate rotations. In data analysis, simple rotations can result in easier to visualize and interpret data. We will describe the mathematics behind rotations and give some data analysis examples.
In our previous section, we used the following example:
and noted that and are the coordinates
library(rafalib)
mypar()
plot(c(-2,4),c(-2,4),xlab="Dimension 1",ylab="Dimension 2",type="n",xaxt="n",yaxt="n",bty="n")
text(rep(0,6),c(c(-2,-1),c(1:4)),as.character(c(c(-2,-1),c(1:4))),pos=2)
text(c(c(-2,-1),c(1:4)),rep(0,6),as.character(c(c(-2,-1),c(1:4))),pos=1)
abline(v=0,h=0)
arrows(0,0,2,3,lwd=3)
segments(2,0,2,3,lty=2)
segments(0,3,2,3,lty=2)
text(2,3," Y",pos=4,cex=3)

However, mathematically we can represent the point with other linear combinations:
The new coordinates are:
Graphically, we can see that the coordinates are the projections to the spaces defined by the new basis:
library(rafalib)
mypar()
plot(c(-2,4),c(-2,4),xlab="Dimension 1",ylab="Dimension 2",type="n",xaxt="n",yaxt="n",bty="n")
text(rep(0,6),c(c(-2,-1),c(1:4)),as.character(c(c(-2,-1),c(1:4))),pos=2)
text(c(c(-2,-1),c(1:4)),rep(0,6),as.character(c(c(-2,-1),c(1:4))),pos=1)
abline(v=0,h=0)
abline(0,1,col="red")
abline(0,-1,col="red")
arrows(0,0,2,3,lwd=3)
y=c(2,3)
x1=c(1,1)##new basis
x2=c(0.5,-0.5)##new basis
c1 = crossprod(x1,y)/crossprod(x1)
c2 = crossprod(x2,y)/crossprod(x2)
segments(x1[1]*c1,x1[2]*c1,y[1],y[2],lty=2)
segments(x2[1]*c2,x2[2]*c2,y[1],y[2],lty=2)
text(2,3," Y",pos=4,cex=3)

We can go back and forth between these two representations of using matrix multiplication.
and carry the same information, but in a different coordinate system.
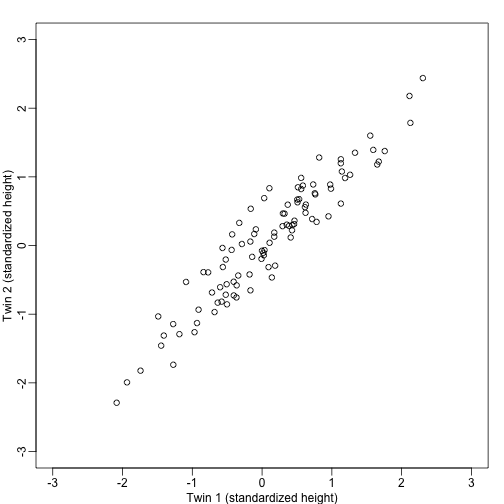
Example: Twin heights
Here are 100 two dimensional points
Here are the rotations:
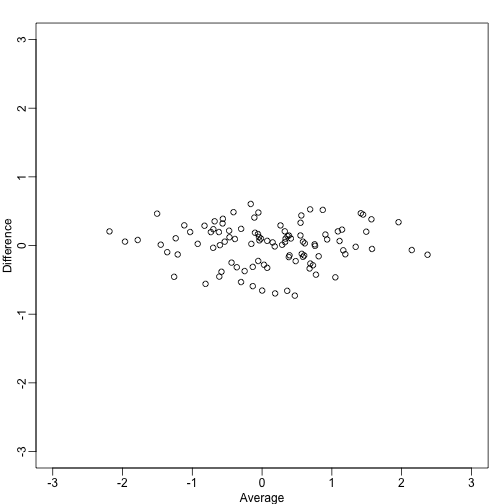
What we have done here is rotate the data so that the first coordinate of is the average height, while the second is the difference between twin heights.
We have used the singular value decomposition to find principal components. It is sometimes useful to think of the SVD as a rotation, for example , that gives us a new coordinate system in which the dimensions are ordered by how much variance they explain.